Billing Feature within the soybean ecosystem
Product Design Work transitioning a royalty billing system from a shared platform to a dedicated Bayer platform.Client
Bayer, 2022
Problem Definition
In the midst of a transition, I perceived potential rejection from the users affected by a systems decoupling. Since the changes were mandatory and defined by governmental entities, the challenge was to understand the impact of these changes on the daily lives of the end users and propose solutions that would help rather than hinder.
My Role
Responsible for the research and design aspects, which involved primary research with stakeholders, business team members, and direct users who would be affected by the proposed paradigm shift.
Overview
Market Changes
In a scenario where two competitors need to share a royalty billing system, excellent customer service and user experience are crucial for retaining partners and maintaining market share.
Bayer has dominated the soybean biotechnology market in Brazil with over 70% penetration in the last decade.
In 2022, Corteva Agriscience introduced its own soybean technology, and the strategic teams at Bayer and Corteva established an agreement specifying the adaptation of Bayer's current system into a shared system, which would also accommodate Corteva (and potentially other companies holding soybean technologies).
Proposed Scenario
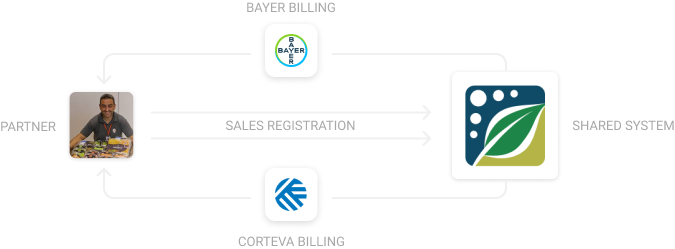
Brazilian laws are quite restrictive regarding large companies sharing sensitive information on a platform that moves billions of dollars annually. Therefore, companies using Bayer/Corteva products must report all sales of royalty-protected products on the shared system, and the royalty payments would occur in separate systems.
Initial Billing Scenario

Shared Billing Scenario
Empathy
Primary Research - Engaging with Partners and Business Partners
Just because something is changing doesn't mean it's beneficial for your business or your users.
I took the initiative to research the impact of this change on the daily lives of the farmers, who are the users that will enter the system and report their sales.
It was more than just a 'yes' or 'no' question, and I already had an idea that this change would not be well received by the partner vendors. Within Bayer, there was a good relationship with the partners, so they were always available for dialogue creation, especially when the topic was related to changes in their workload.
Process Mapping and User Journeys
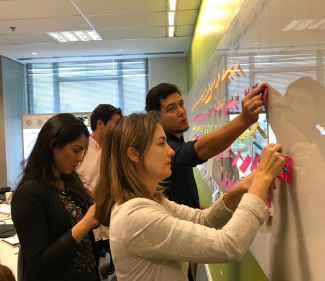
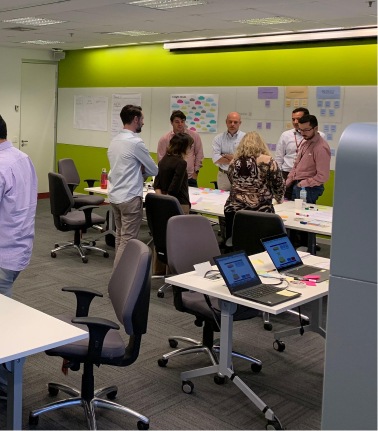
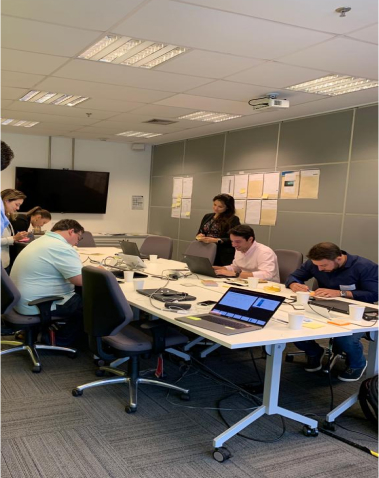
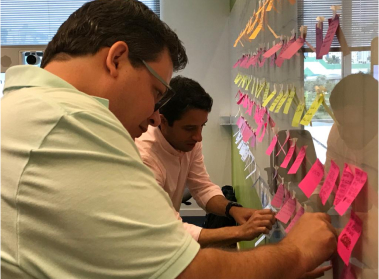
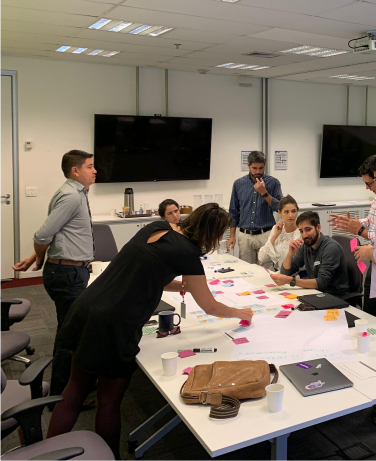
I spoke with approximately 40 seed vendors (both large and small) to map out how they worked and how our system interacted with the daily operations of our partners.
Some conversations were held in person, while others were conducted remotely.
With a few sessions, I was already able to confirm my hypothesis. By mapping the processes and collecting the data, I realized that the change would not be welcomed by the partners.
These changes were listed, grouped, and prioritized.
This feedback was instrumental in conducting deeper research to understand where and why the difficulties were present in the daily lives of users and how they would worsen with the new paradigm imposed on the new users.

Secondary Research - Contact with Other Areas of the Company
Analysis of sales report documents
I delved deeply into sales documents that were generated internally with data from all sales reported by all partner companies to understand how these companies prefer to manage their payments and to look for behavior patterns.
The documents had more than 600,000 lines, but this analysis was essential for identifying a significant opportunity when setting payment dates.
The vast majority of partners exhibited similar behavior when choosing payment dates, depending on the time of year they were making payments.
This pattern was consistent in documents dating back up to three years.
Most of the records that were created and corrected came from branches and almost never from headquarters. With this information, we identified a deficiency in the tool that did not provide data clearly to users, making analysis difficult and leading to errors in choosing payment methods.
Analysis of Bayer's Internal Sales Projections
I cannot disclose much information about the company’s internal processes. However, in conversation with the sales team, I discovered that there were intentions to change the product sales strategy for the market by the company. Taking this information into account, we made some layout changes to accommodate these future alterations.
I know this part is a bit cryptic, but I think it's important to show that the process also involved actions and desires from the business team, as well as analyses of end-user behavior.
Definition
Personas
I compiled the characteristics of the interviewees and created three personas to guide us through the process and ensure that we were on the right track regarding the pains, needs, and frustrations of our audience.
Profile
João is an experienced sales manager with over 20 years in the agricultural sector. He is responsible for managing a team of salespeople and ensuring that sales targets are met. João is highly organized and has an excellent relationship with clients.
Needs
- Needs to monitor the daily sales of the team and provide accurate reports.
- Requires an integrated platform to record and report the sales of soybean seeds in the system.
- Desires an intuitive interface to quickly access sales and royalty information.
Frustrations
- Spends too much time dealing with manual reports and non-integrated systems.
- Finds it difficult to efficiently consolidate sales and royalty data.
Goals
- Automate the process of recording sales and royalty reports.
- Improve the accuracy and efficiency of reports.
- Increase the satisfaction and performance of the sales team.
Pains
Bayer had a much larger market share and, therefore, much more to lose by compromising the user experience.
To move forward, we needed to address the pains and opportunities to improve the overall experience and turn a 'no' into a 'yes.'
How Might We's
Using the "How Might We?" method, I utilized all the knowledge I gained from the interviews, document analyses, and various company areas to focus ideation and address the right problems.
How can we increase the visibility of the monthly expenses of each branch and headquarters?
How can we give users more freedom to modify payment choices that have already been reported?
How can we reduce the workload for users when selecting payment dates?
How can we reduce user distrust regarding the quality of services?
Ideation
High-Fidelity Prototyping
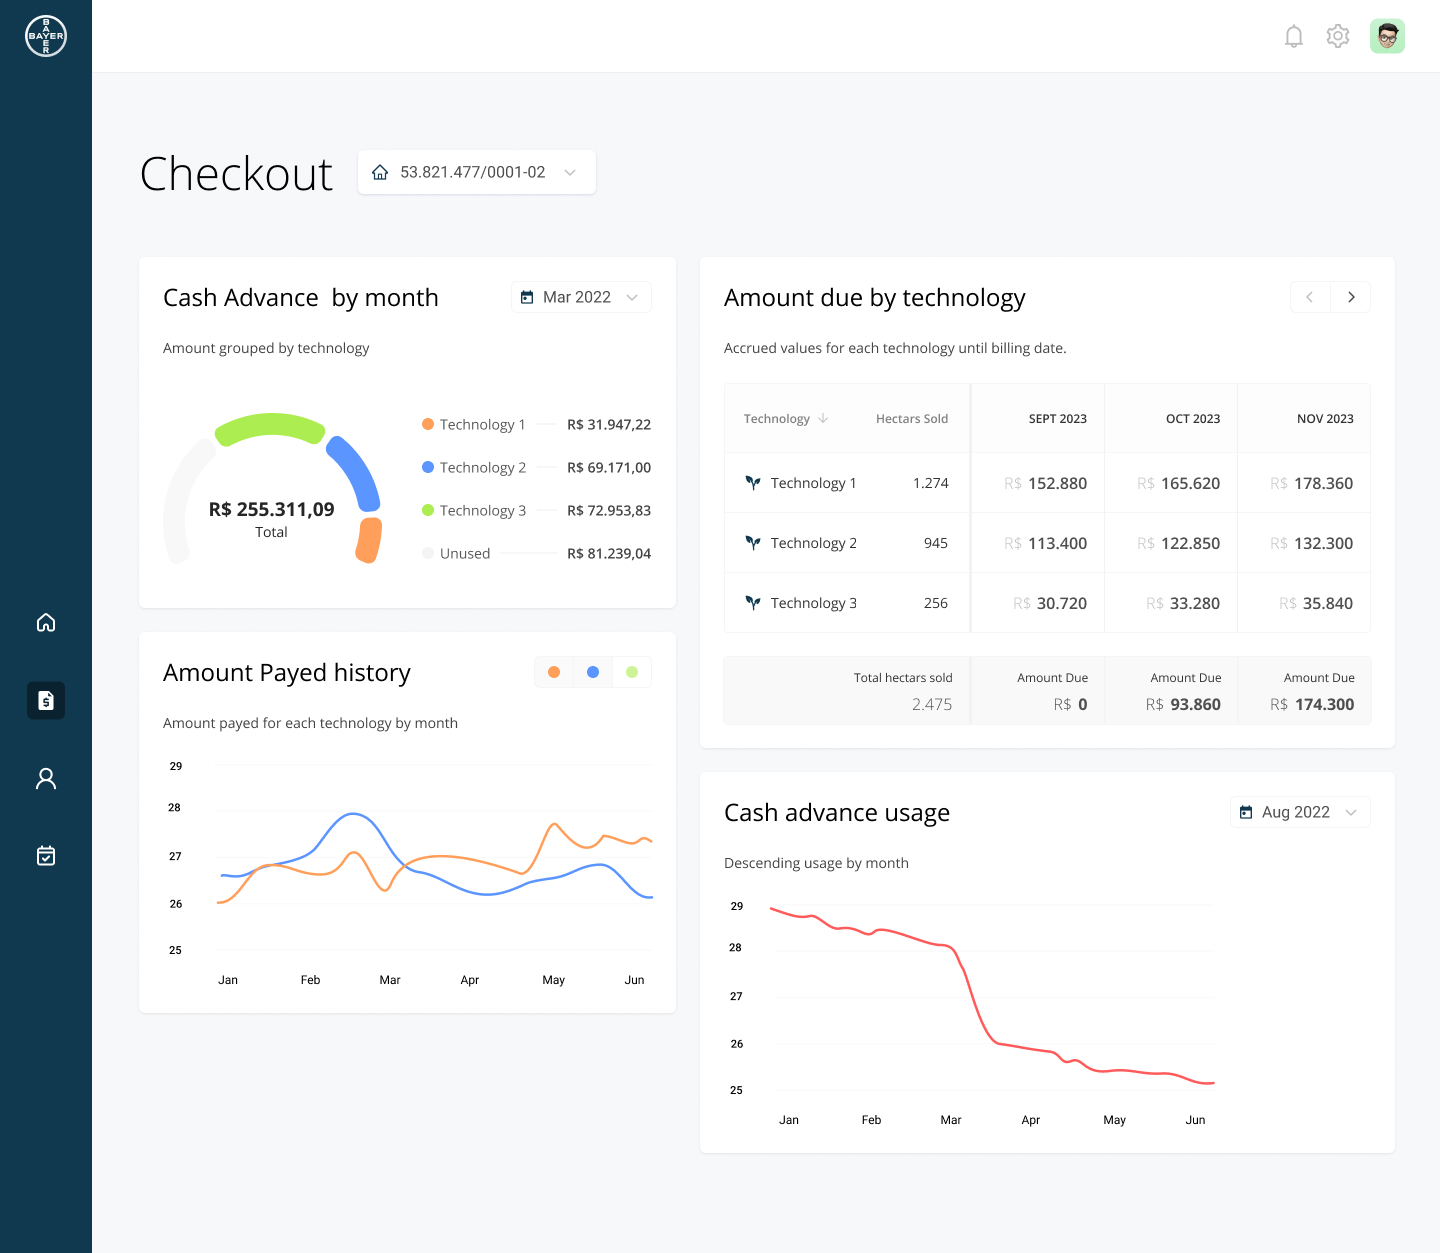
Having a better understanding of our audience, I knew they had a more analytical characteristic and less power of abstraction. So, as this was a very important tool and billions of dollars would flow through this tool every year, I decided to create high-quality prototypes to conduct usability tests.
Synthesizing all the learning from the Empathy and Definition phases, I created different layouts for the tool until I arrived at a few satisfactory ideas that would be taken to a usability test.

Testing
Usability Testing
- Purpose: Understand if users could find vital information and check if the solutions based on our "How Might We?" statements were implemented correctly.
- Audience: Ten partners who were system operators, from different areas of the country, with varying levels of knowledge and different levels of animosity toward the platform. This disparity of opinions was important for testing the tool under various usage extremes.
- Team: The tests were conducted by me, along with a note-taker, and I also invited one of the stakeholders of this endeavor as an observer (and only an observer) so they could see the value of these tests.
- Structure: The sessions were mostly conducted online and recorded from two perspectives: Participants and screen. A mix of UserZoom and Microsoft Teams was used for ease of user access.
Learnings and Results
Final Version
After an intense round of discovery, hours and hours poring over endless Excel files with hundreds of thousands of lines, and a lot of empathy, it becomes increasingly clear to me that the designer who dares to ask difficult questions to the right people can achieve surprising results that can even provide insights for behavioral changes in other sectors of the company.
An application was delivered that not only performed the task of decoupling the company's billing system but also provided more agency for the user, reduced the number of errors, and saved time in a process that had always been mandatory.
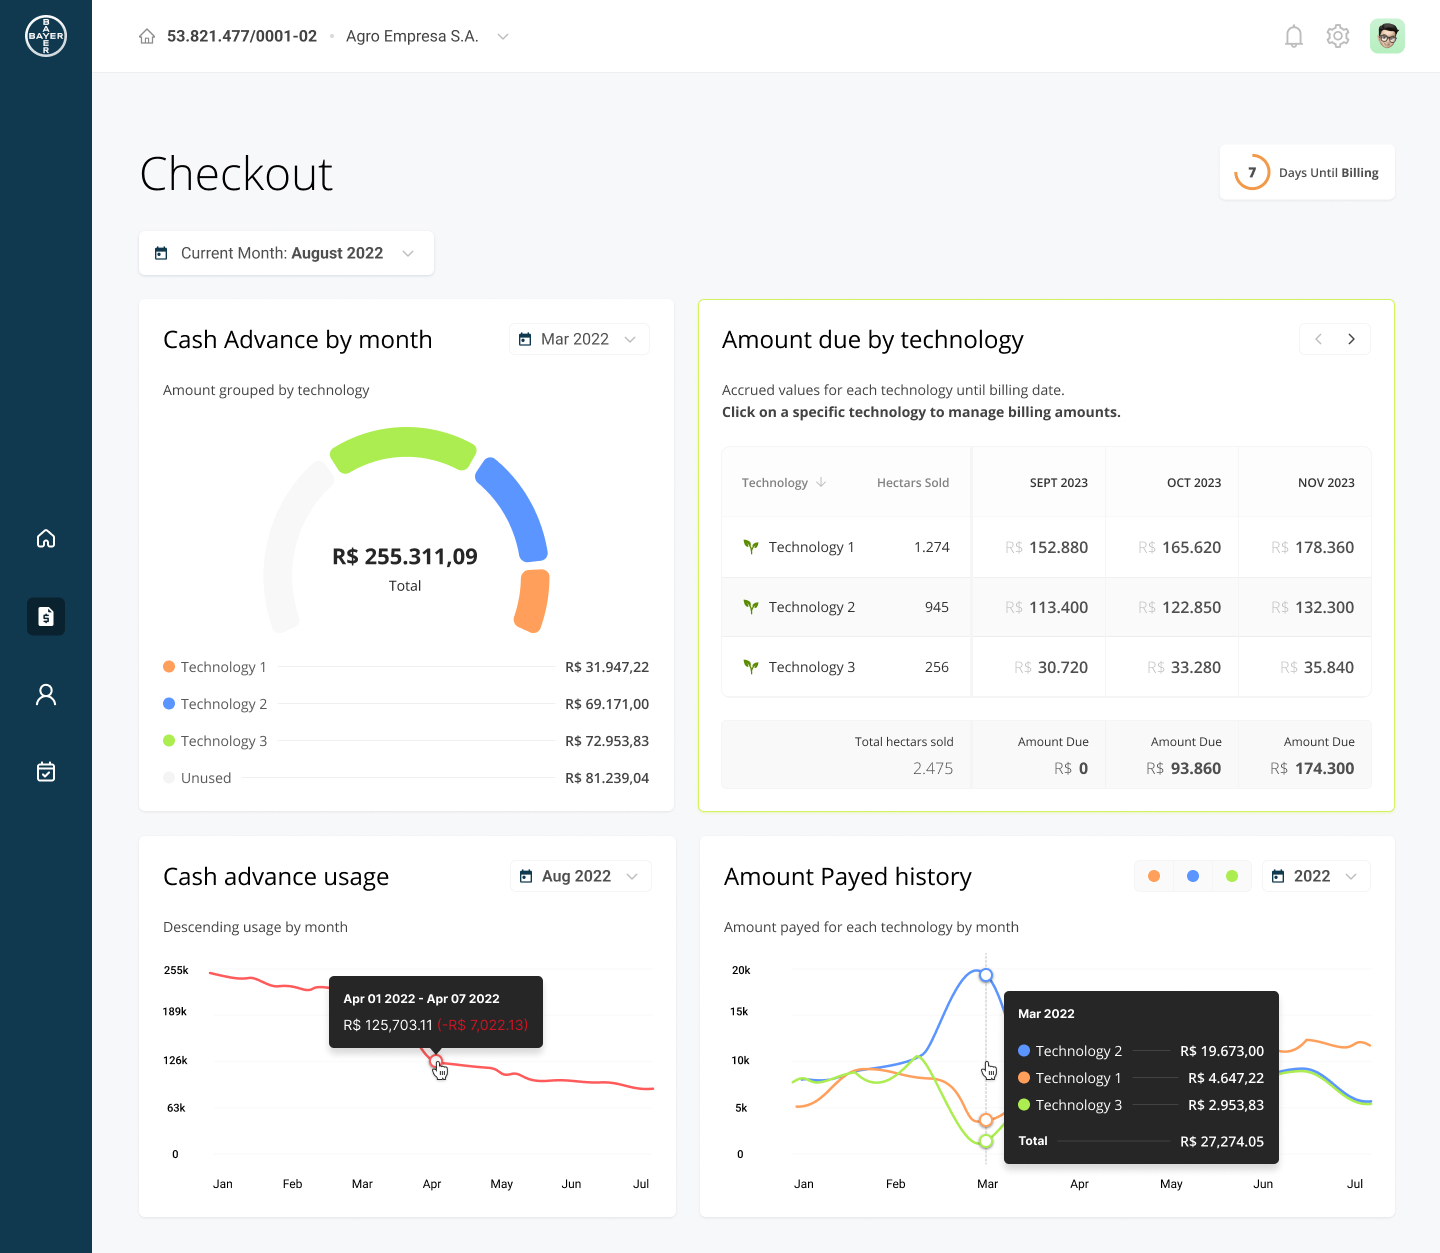
Partner Dashboard
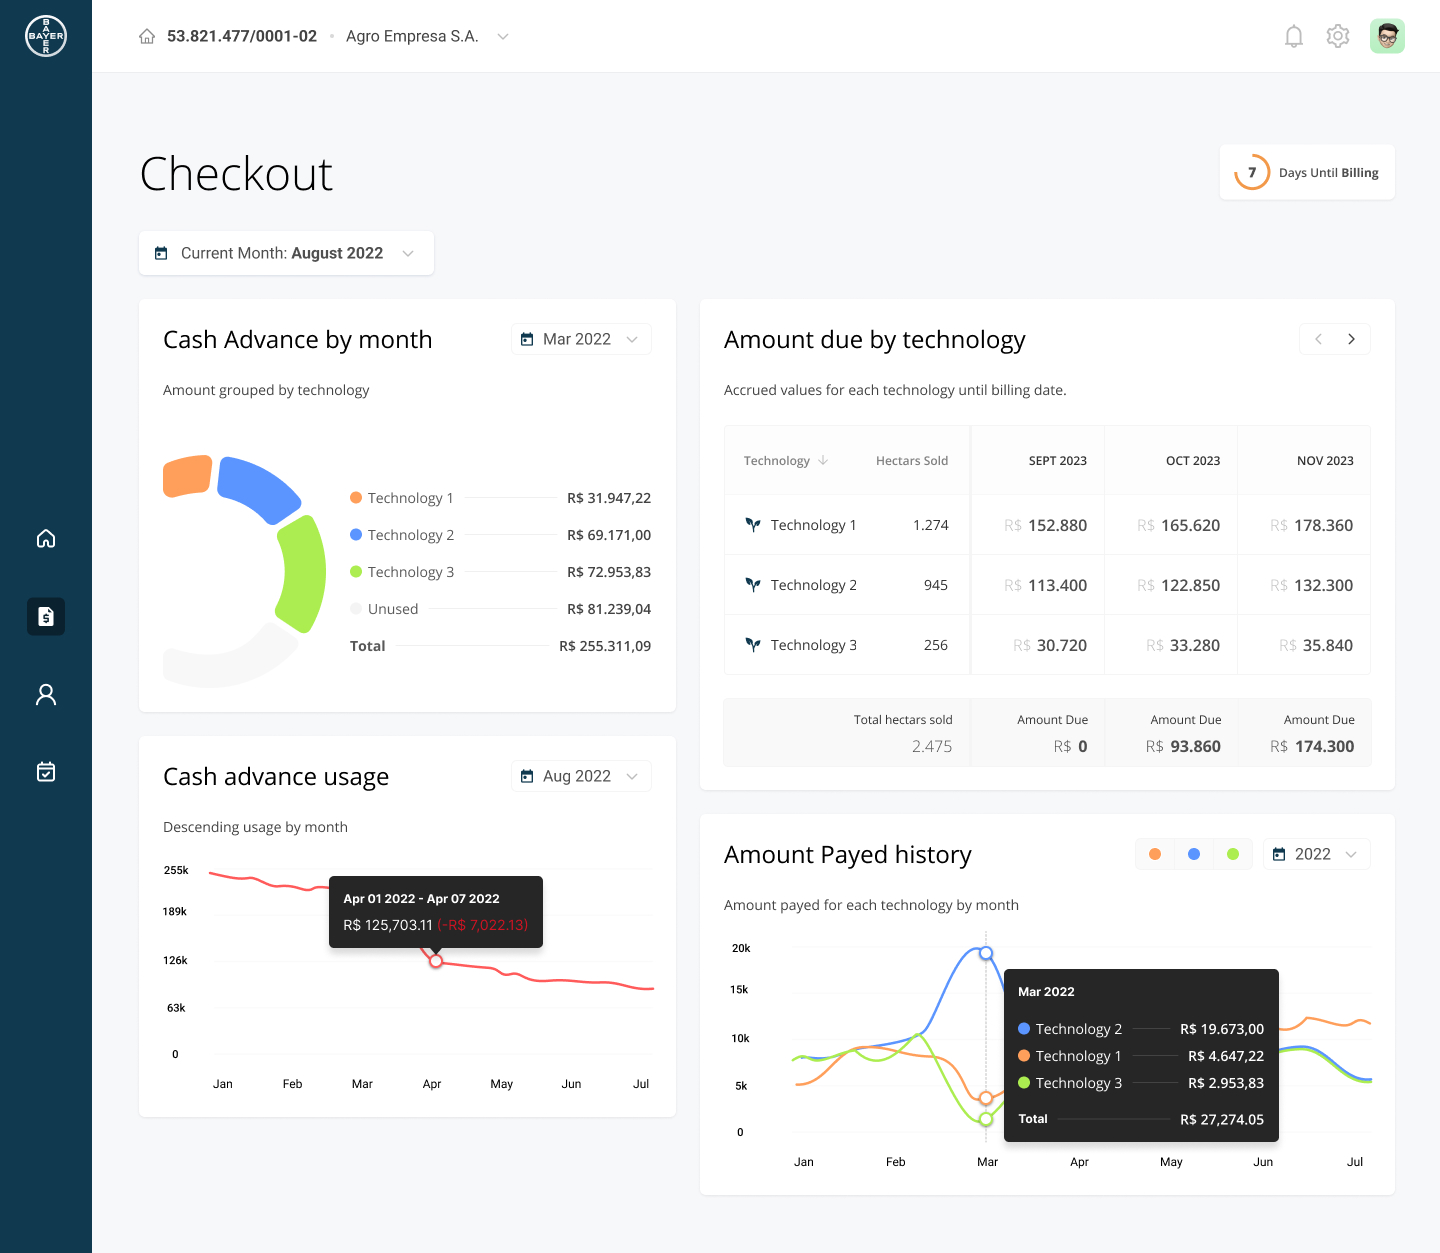
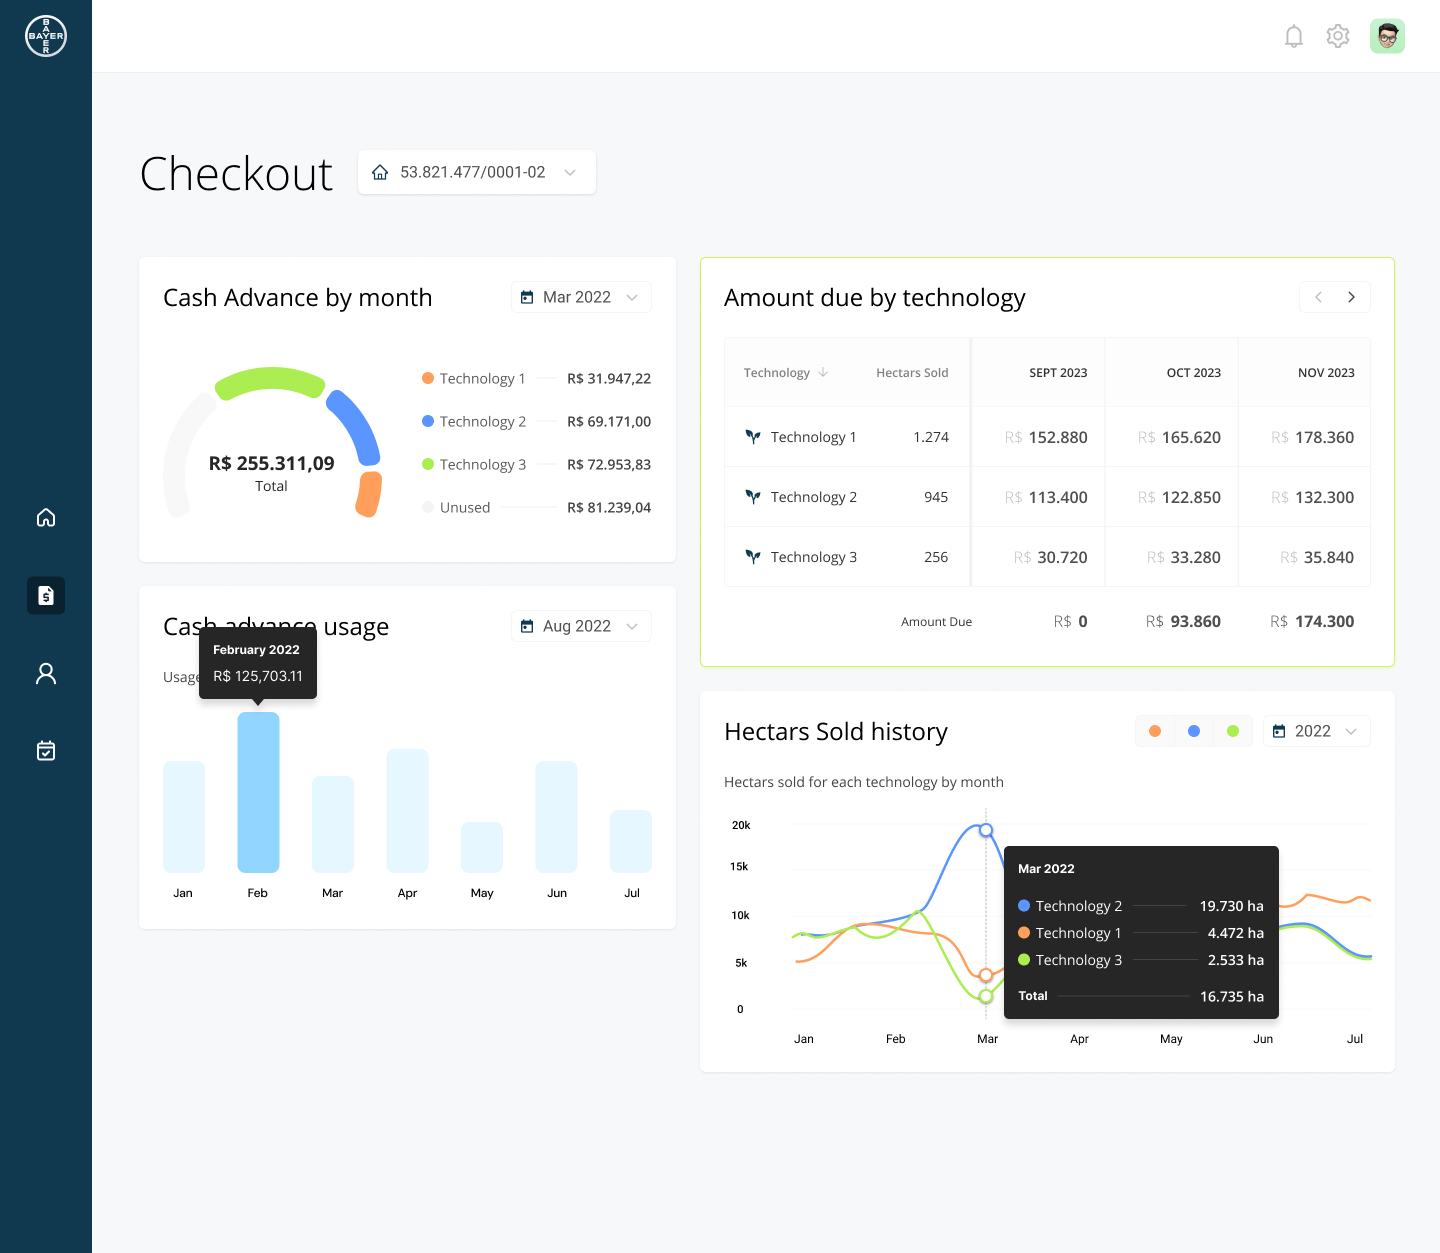
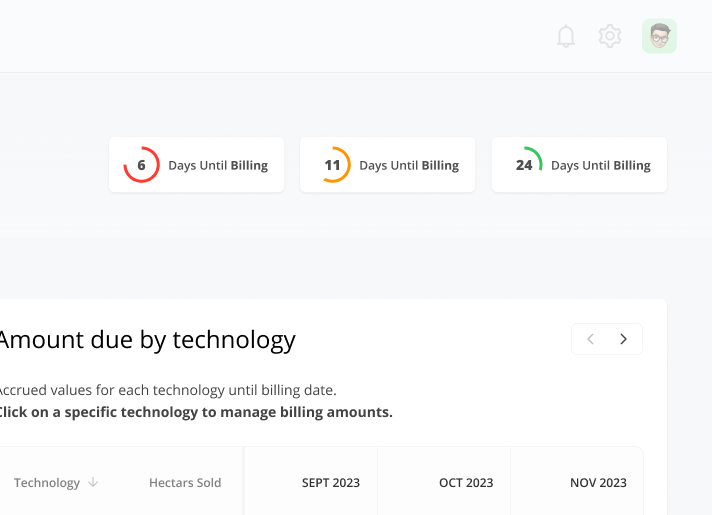
In this area, partners have an overview of everything that happens with their billing. They can understand their upcoming expenses, view credit amounts and analyze expense charts.

Interaction Details
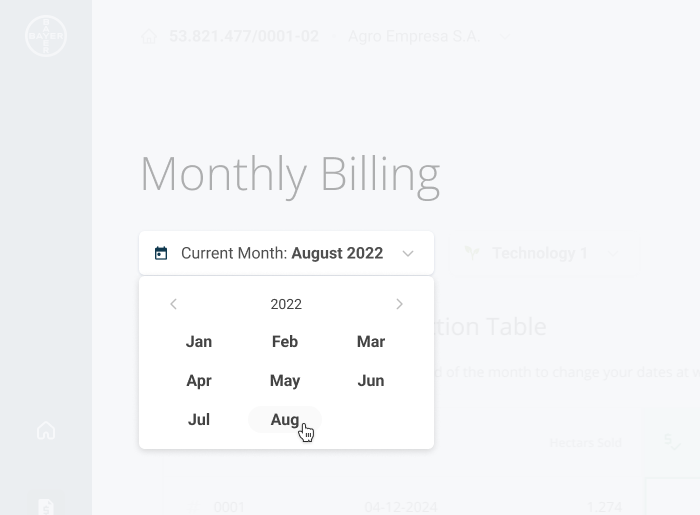
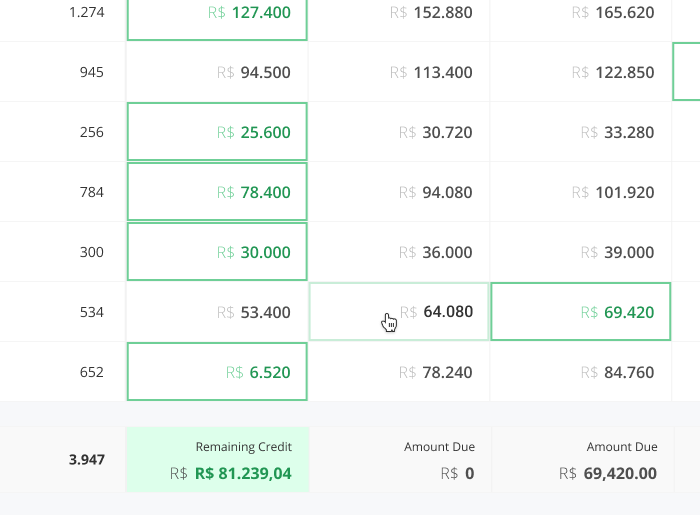
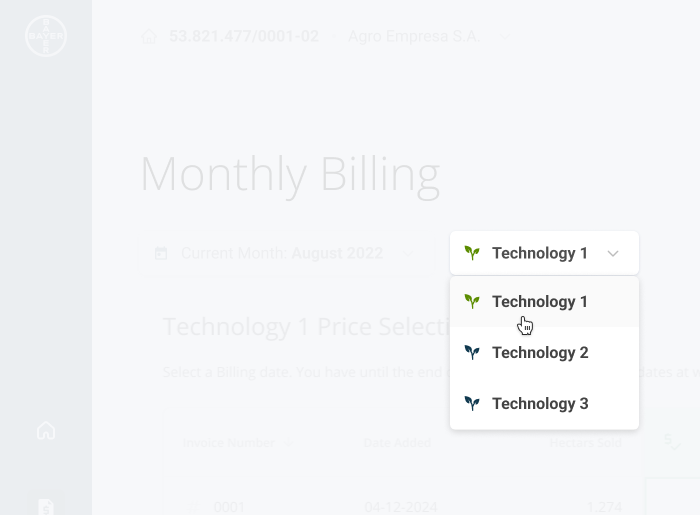
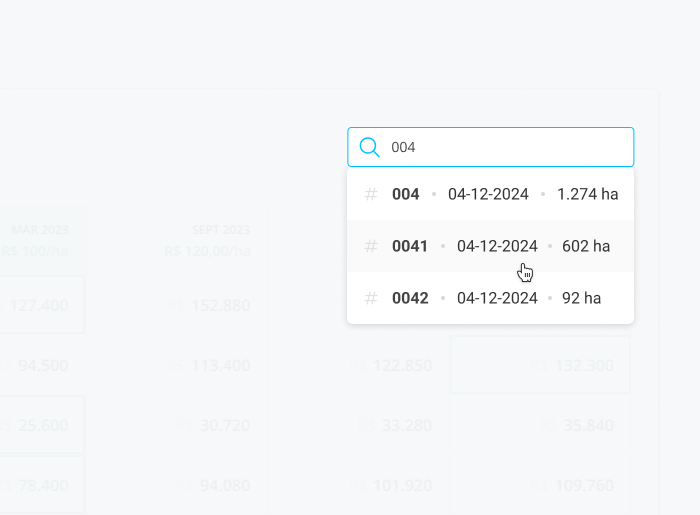
Price Selection Area
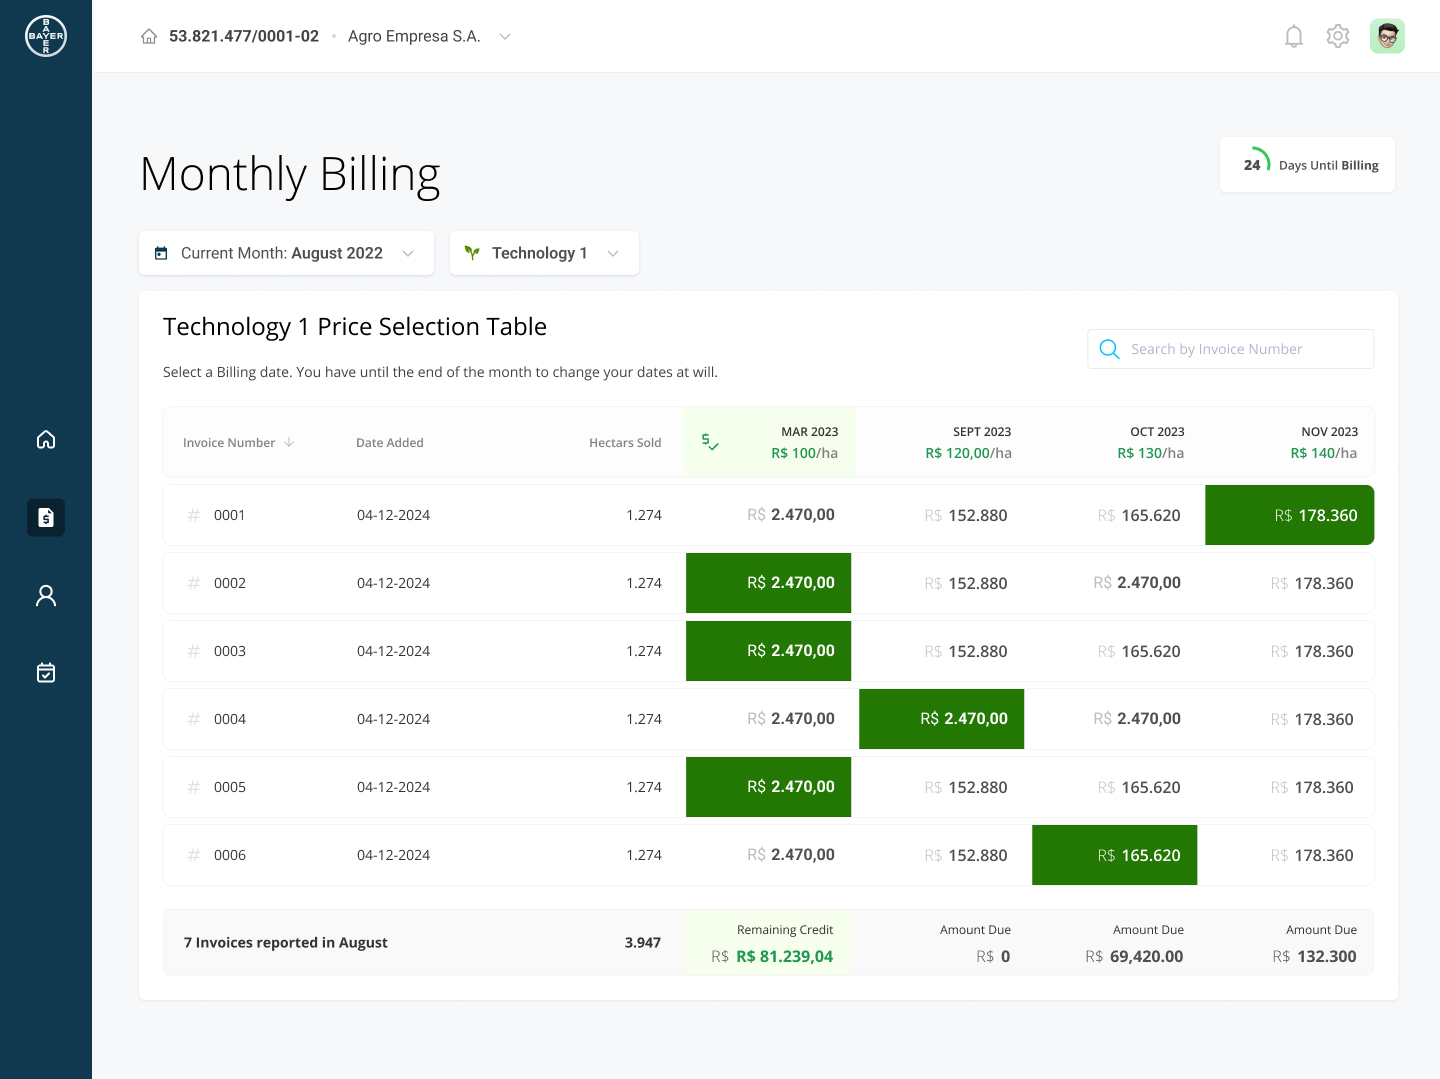
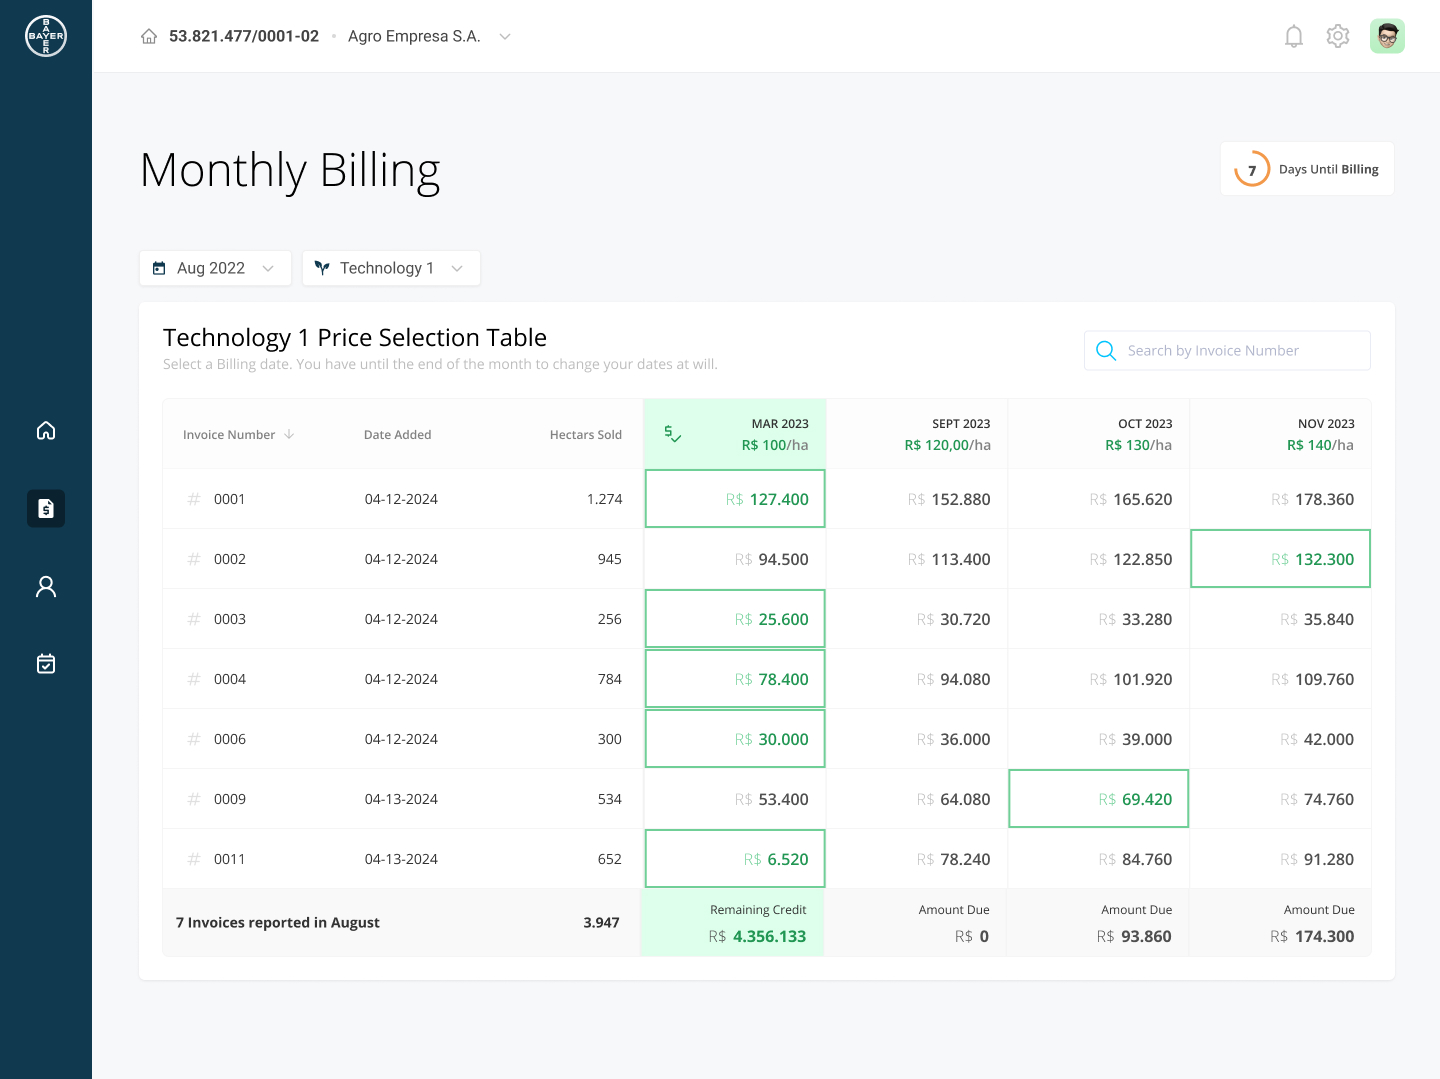
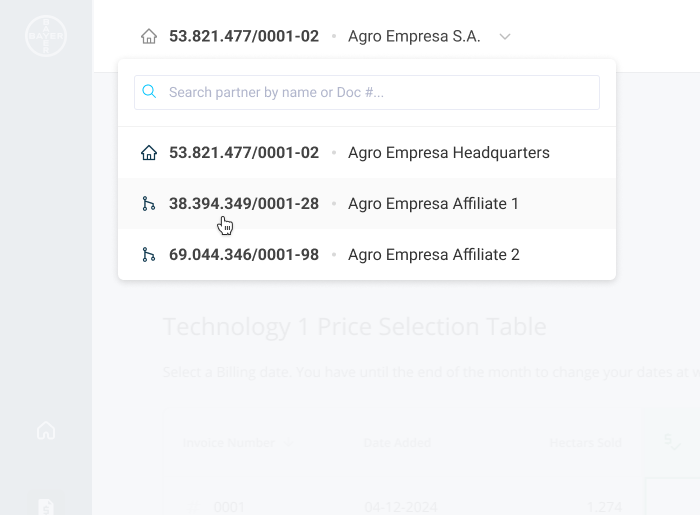
Here, partners have complete freedom to select the prices related to each invoice. This interface provides a real-time view of all amounts they will pay at the end of each cycle.

Interaction Details
